PowerBi Dashboard
Business intelligence is the newest field I am exploring and I am very excited to venture in it. I created a simple dashboard using a dataset found on Kaggle. Using my skills in SQL I cleaned the data as much as possible. After that, I converted the data into a CSV file and imported it to PowerBi.
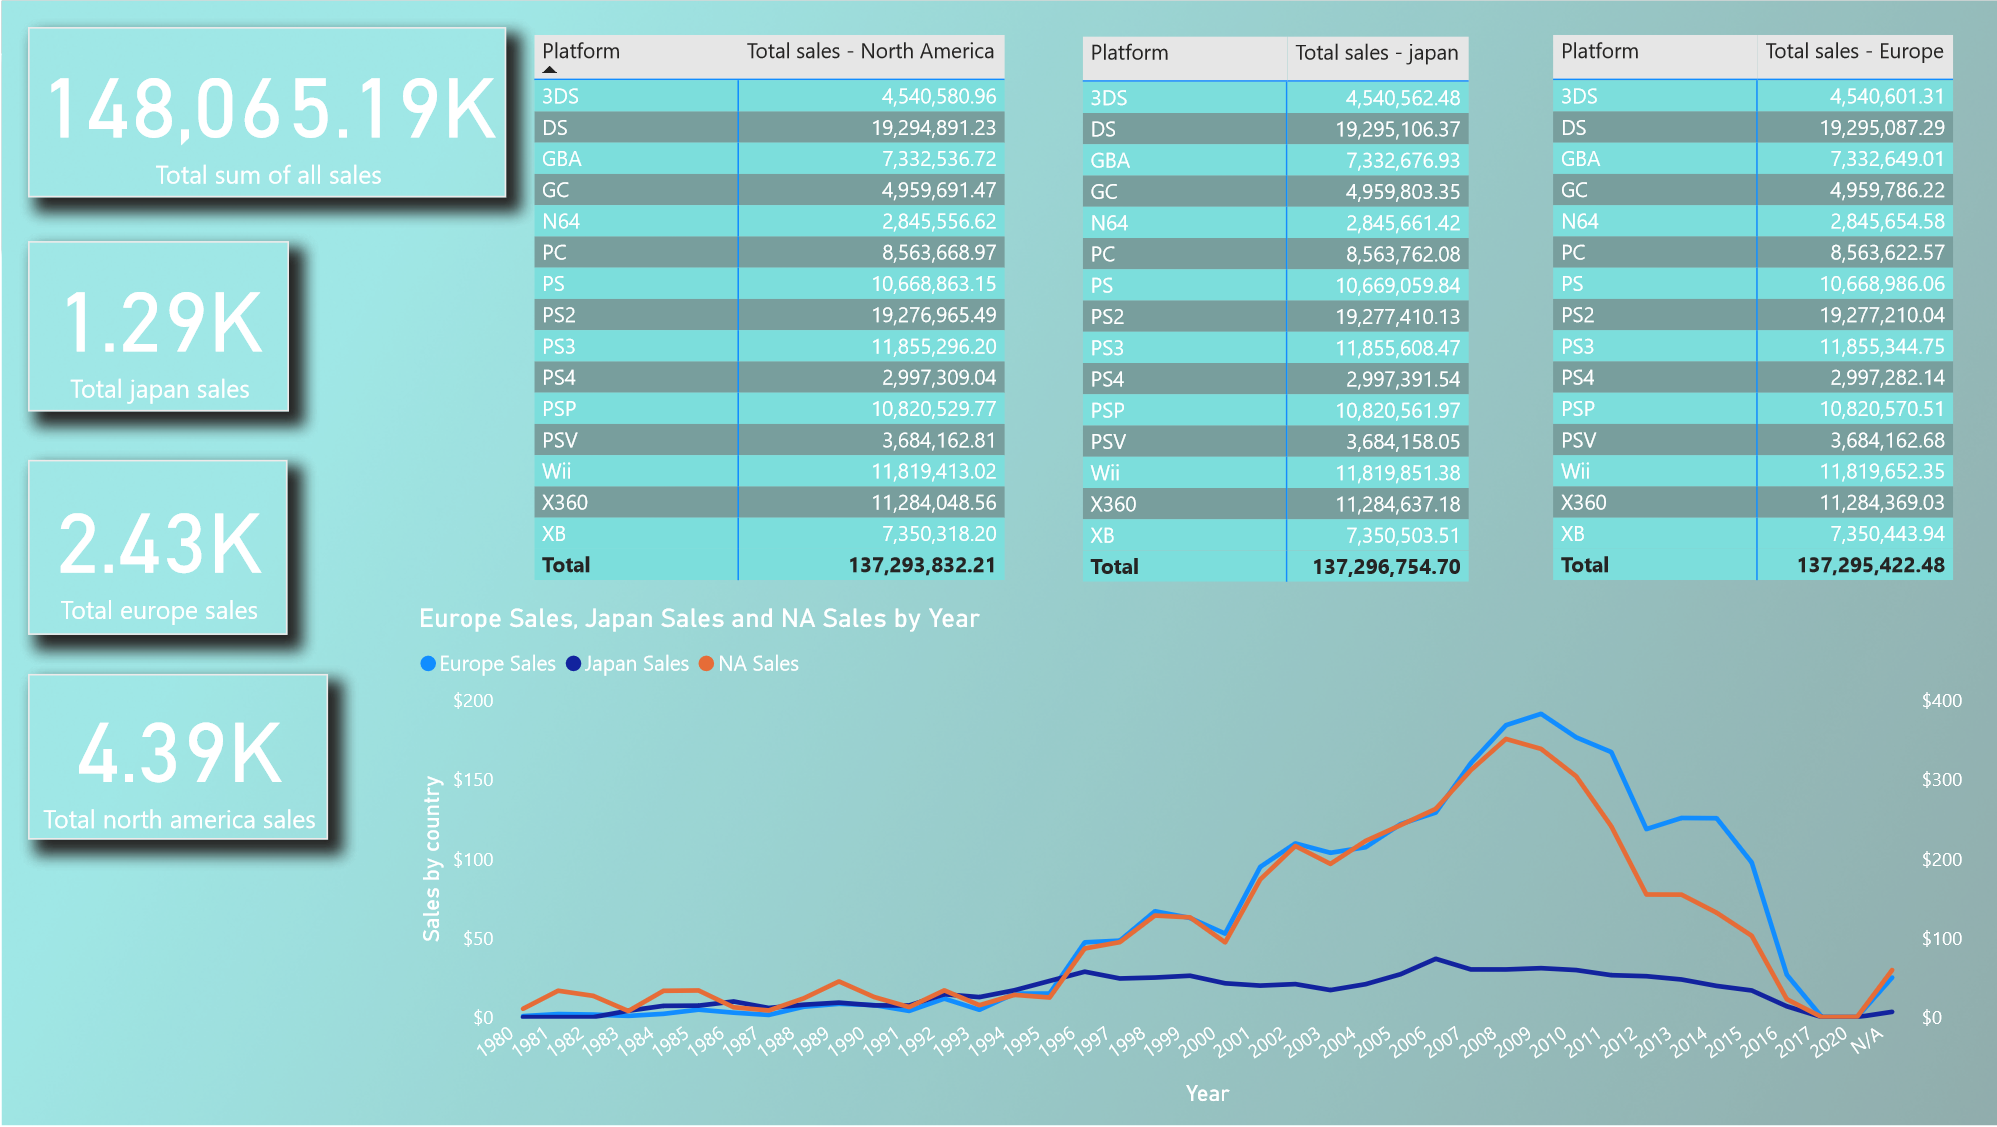
The dataset I used was a report on video game sales and what the best publishers were and the best games as well. I created a dashboard to show the top selling video game platforms. I then split them by the main regions provided, North America, Japan, and Europe.
I also created key performance indicator cards that show the total sales each platform did in each region.
I also created a line graph that shows how each region did in sales over the past forty years.
Below is the dashboard used.